For any manufacturing facility operating plastic container production at scale, understanding the true operating cost of machinery is not optional — it is a prerequisite for sound capital investment decisions. Among all operational variables, compressed air and electrical energy consumption represent the two largest ongoing utility expenses associated with running an injection stretch blow molding machine. Yet these figures are rarely communicated clearly in sales literature, and benchmarks can vary dramatically depending on machine size, design architecture, container specifications, and production throughput.
This guide was written to fill that gap. Drawing on engineering data, real-world production experience, and decades of collective knowledge from leading isbm-koneiden valmistaja expertise, we break down both utility consumption categories in measurable, comparable terms. Whether you are evaluating your first ISBM machine or benchmarking your existing fleet against newer technology, the data and context in this article will help you make a more informed decision.
It is worth noting upfront that a single stage injection stretch blow molding machine operates fundamentally differently from a two-stage reheat-stretch-blow system. In the one-step ISBM process, injection, conditioning, stretching, and blowing all occur within a single machine cycle — which has significant implications for both compressed air usage patterns and electrical load profiles. We will explore these differences in detail throughout the article.
What Is the Typical Compressed Air Consumption of an ISBM Machine?
Compressed air is the backbone of the blowing phase in any injection stretch blow molding system. Unlike electricity, which powers the mechanical and thermal components of the machine, compressed air performs the physical deformation of the preform into the final bottle shape — pushing molten or semi-molten PET, PP, or other thermoplastics against the cold mold cavity walls at precisely controlled pressures and flow rates.
ISBM machines typically use two distinct air pressure circuits: a low-pressure circuit for pre-blowing and a high-pressure circuit for the final blow. Understanding the purpose and typical parameters of each is essential for correctly sizing your compressed air infrastructure and estimating utility costs.
Low-Pressure Pre-Blow Air
Typically ranging from 6 to 10 bar (87–145 psi), the pre-blow circuit gently expands the preform before the high-pressure stage. Flow volumes per cycle depend on container volume but generally fall between 0.5 and 3.0 Nm³/h per cavity for small to medium containers. This lower-pressure air is usually supplied by a standard industrial air compressor already present in most manufacturing facilities.
High-Pressure Final Blow Air
This is where the majority of compressed air cost is concentrated. Final blow pressures typically operate between 25 and 40 bar (363–580 psi) for PET containers, and between 12 and 20 bar for PP or HDPE applications. High-pressure compressors for this stage require dedicated, specialized equipment and represent a significant capital and operating expense.
Air Recovery Systems
Modern ISBM machines — particularly from quality-focused injection stretch blow molding machine manufacturers — increasingly incorporate air recovery or recycling systems that capture and reuse a portion of the high-pressure air after each blow cycle. These systems can reduce compressed air consumption by 15–30% per bottle produced, significantly lowering both energy bills and compressor wear.
Typical Compressed Air Consumption Benchmarks by Machine Category
| Machine Type | Pre-Blow Pressure | High-Blow Pressure | Total Air Flow (Nm³/h) | Container Volume |
|---|---|---|---|---|
| Small ISBM (2–4 cavity) | 6–8 bar | 25–32 bar | 8–20 Nm³/h | 50 mL – 500 mL |
| Mid-size ISBM (4–6 cavity) | 8–10 bar | 30–38 bar | 20–45 Nm³/h | 200 mL – 2 L |
| Large ISBM (6+ cavity / heavy wall) | 8–12 bar | 35–40 bar | 45–90+ Nm³/h | 1 L – 10 L |
* Values are indicative ranges. Actual consumption depends on cycle time, container geometry, wall thickness, and blowing strategy. Consult your machine supplier for project-specific figures.
Electricity Consumption of an ISBM Machine: What to Expect
Electrical power demand in an ISBM machine is distributed across multiple subsystems. Unlike standalone injection molding machines or standalone blow molding machines, the ISBM integrates both processes — meaning the electrical load profile is more complex and the installed power requirements are higher. However, because no intermediate reheating of preforms is required (as in the two-step SBM process), the total energy per bottle produced can be competitive or superior when optimized correctly.
🔥 Plasticizing & Injection Unit
The extruder screw drive and barrel heaters account for the largest single share of electrical consumption — typically 35–50% of total installed power. Barrel heater bands must maintain precise melt temperatures (commonly 250–290°C for PET). Variable-speed drives on the screw motor significantly reduce idle power draw.
⚙️ Hydraulic Power Unit
Traditional hydraulic ISBM machines use a fixed-displacement hydraulic pump running continuously, consuming 20–30% of total electrical load. This is a known inefficiency: the pump generates heat and noise even during idle portions of the cycle. Many newer machines adopt servo-hydraulic or fully electric actuators to address this.
⚡ Servo Drive Systems
Fully servo-controlled ISBM machines replace most hydraulic actuators with servo motors, which only draw power during active motion phases. This architecture reduces overall electrical consumption by 25–40% compared to conventional hydraulic designs and yields more precise, repeatable motion profiles — directly benefiting container quality.
❄️ Cooling & Temperature Control
Mold cooling circuits, barrel cooling fans, hydraulic oil coolers, and ambient chiller systems collectively consume 10–20% of electrical load. Facilities in tropical climates or with inadequate ventilation may see this figure rise substantially. Chilled water systems tied to the machine represent both a capital and ongoing energy consideration.
🖥️ Controls, HMI & Auxiliaries
PLC systems, operator interface panels, conveyor drives, and ancillary pneumatic controls contribute a relatively minor 3–8% of total electrical consumption. Though individually small, ensuring efficient PLC programming and minimizing parasitic loads from always-on systems yields modest but cumulative savings over time.
Installed Power and Average Consumption: Reference Figures
| Machine Model Class | Clamping Force | Installed Power (kW) | Avg. Running Power (kW) | kWh per 1,000 bottles* |
|---|---|---|---|---|
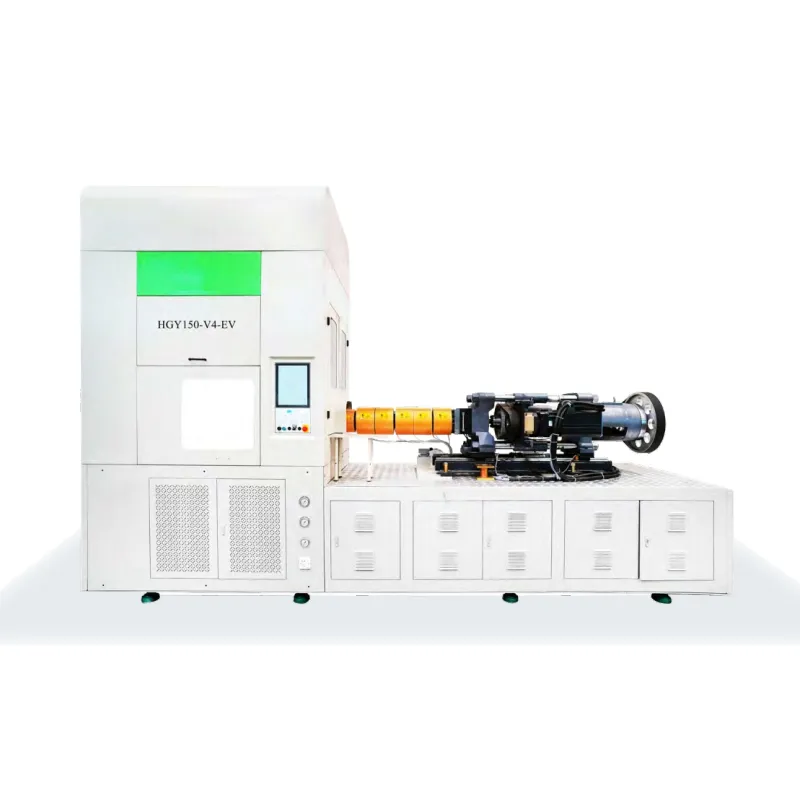
| EP-HGYS150 Class | 150 kN | 35–45 kW | 18–28 kW | 8–16 kWh |
| EP-HGYS200 Class | 200 kN | 55–70 kW | 28–42 kW | 12–22 kWh |
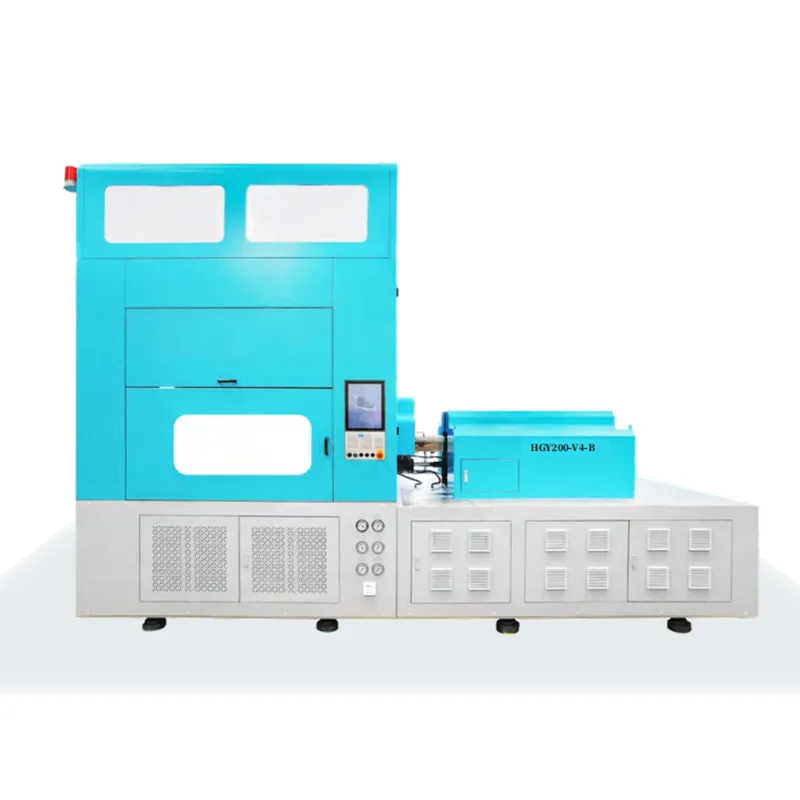
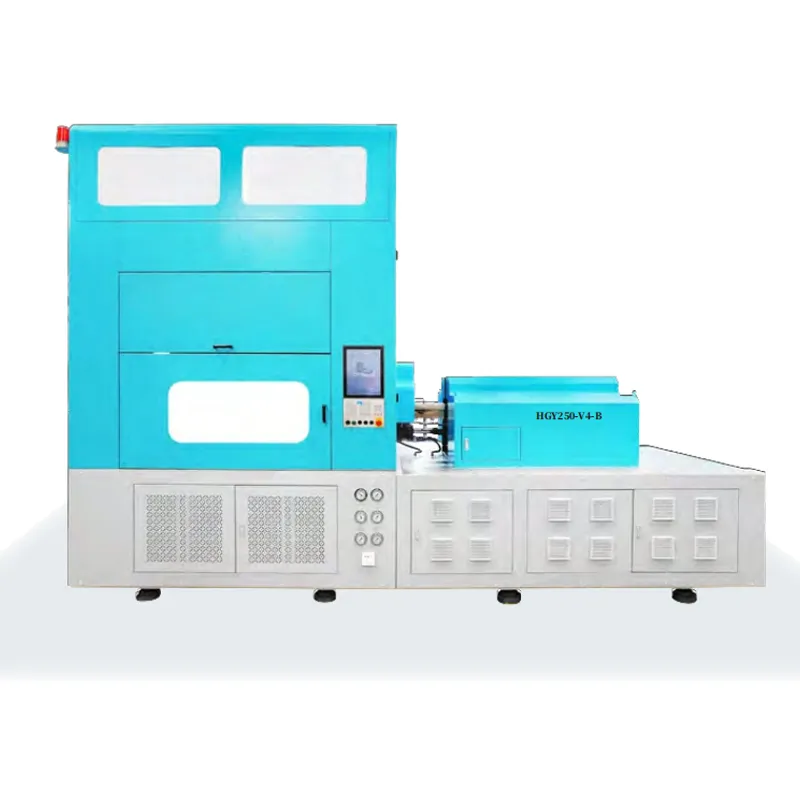
| EP-HGY250 Class | 250 kN | 70–90 kW | 38–58 kW | 16–30 kWh |
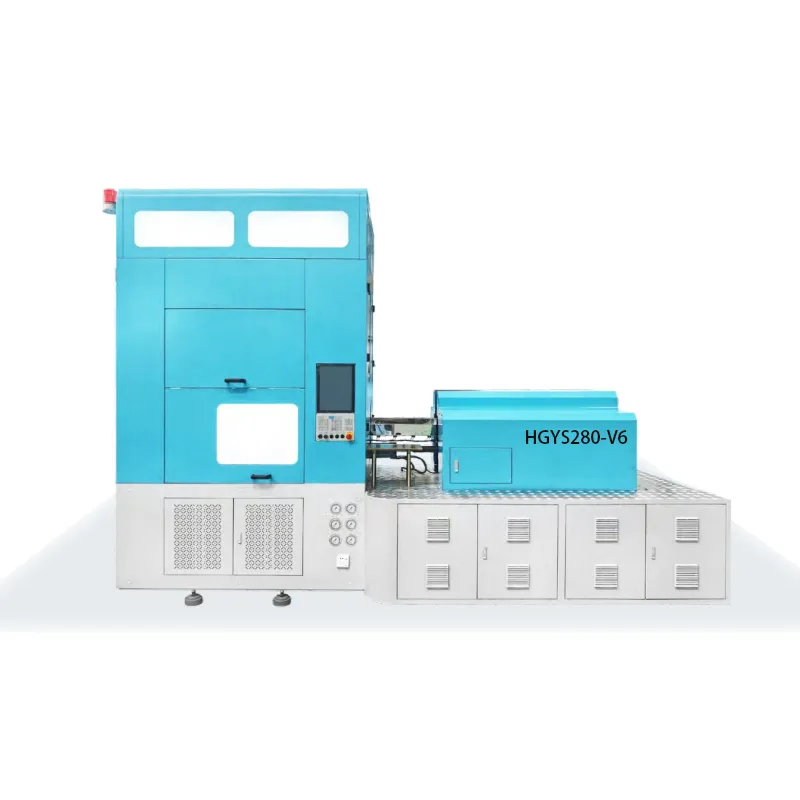
| EP-HGYS280/650 Class | 280–650 kN | 90–160+ kW | 55–100+ kW | 20–45 kWh |
* Per 1,000 bottles produced at rated output. Actual figures vary based on material, cycle time, container volume, and ambient conditions. Servo-driven models will typically sit at the lower end of the range.
Key Factors That Influence Compressed Air and Electricity Consumption
The figures presented above are useful reference points, but actual utility costs at any given facility will depend heavily on a constellation of technical and operational variables. Understanding these factors enables procurement teams to make more accurate TCO (Total Cost of Ownership) projections and to identify levers for cost reduction during the machine selection and integration process.
Container Volume and Wall Thickness
Larger containers require more air volume per cycle. A 1.5-liter bottle will consume significantly more compressed air per unit than a 250 mL bottle, even at identical pressures. Similarly, thicker-walled containers require longer cooling dwell times, which extends cycle time and directly increases electricity consumption per unit.
Number of Cavities and Station Count
More cavities mean more bottles per cycle, which improves the energy-per-unit metric dramatically. A 6-cavity machine running at 70% of a 4-cavity machine’s cycle time will nearly always outperform the smaller machine on energy efficiency per 1,000 bottles. Station count (3-station, 4-station, 6-station) also affects the balance between injection, conditioning, and blowing time allocations.
Machine Drive Architecture
This is arguably the most impactful single design variable. Hydraulic machines with fixed-displacement pumps consume power continuously. Servo-hydraulic machines reduce this significantly. Fully electric/servo machines eliminate idle hydraulic power almost entirely. When evaluating isbm machine for sale options, always request the servo vs. hydraulic specification and request independent energy consumption data at rated output.
Raw Material and Processing Temperature
PET requires processing temperatures of 250–290°C, while PP and HDPE can be processed at lower temperatures (160–230°C), reducing barrel heating energy. Material viscosity, moisture content (critical for PET which must be dried to <0.02% moisture before processing), and IV value all affect screw torque requirements and therefore electrical consumption in the plasticizing unit.
Cycle Time Optimization
Machines running at sub-optimal cycle times waste both compressed air (through premature venting or inadequate pressure hold) and electricity (through extended heating phases). Proper cycle time optimization by experienced process engineers can reduce energy per unit by 10–20% on machines that have not been properly commissioned.
Ambient Conditions and Infrastructure
High ambient temperatures increase cooling load demands on both the machine and the compressed air system. Leaks in compressed air distribution lines — extremely common in older facilities — can invisibly inflate consumption by 20–30%. Regular auditing of compressed air infrastructure is essential before benchmarking machine performance accurately.
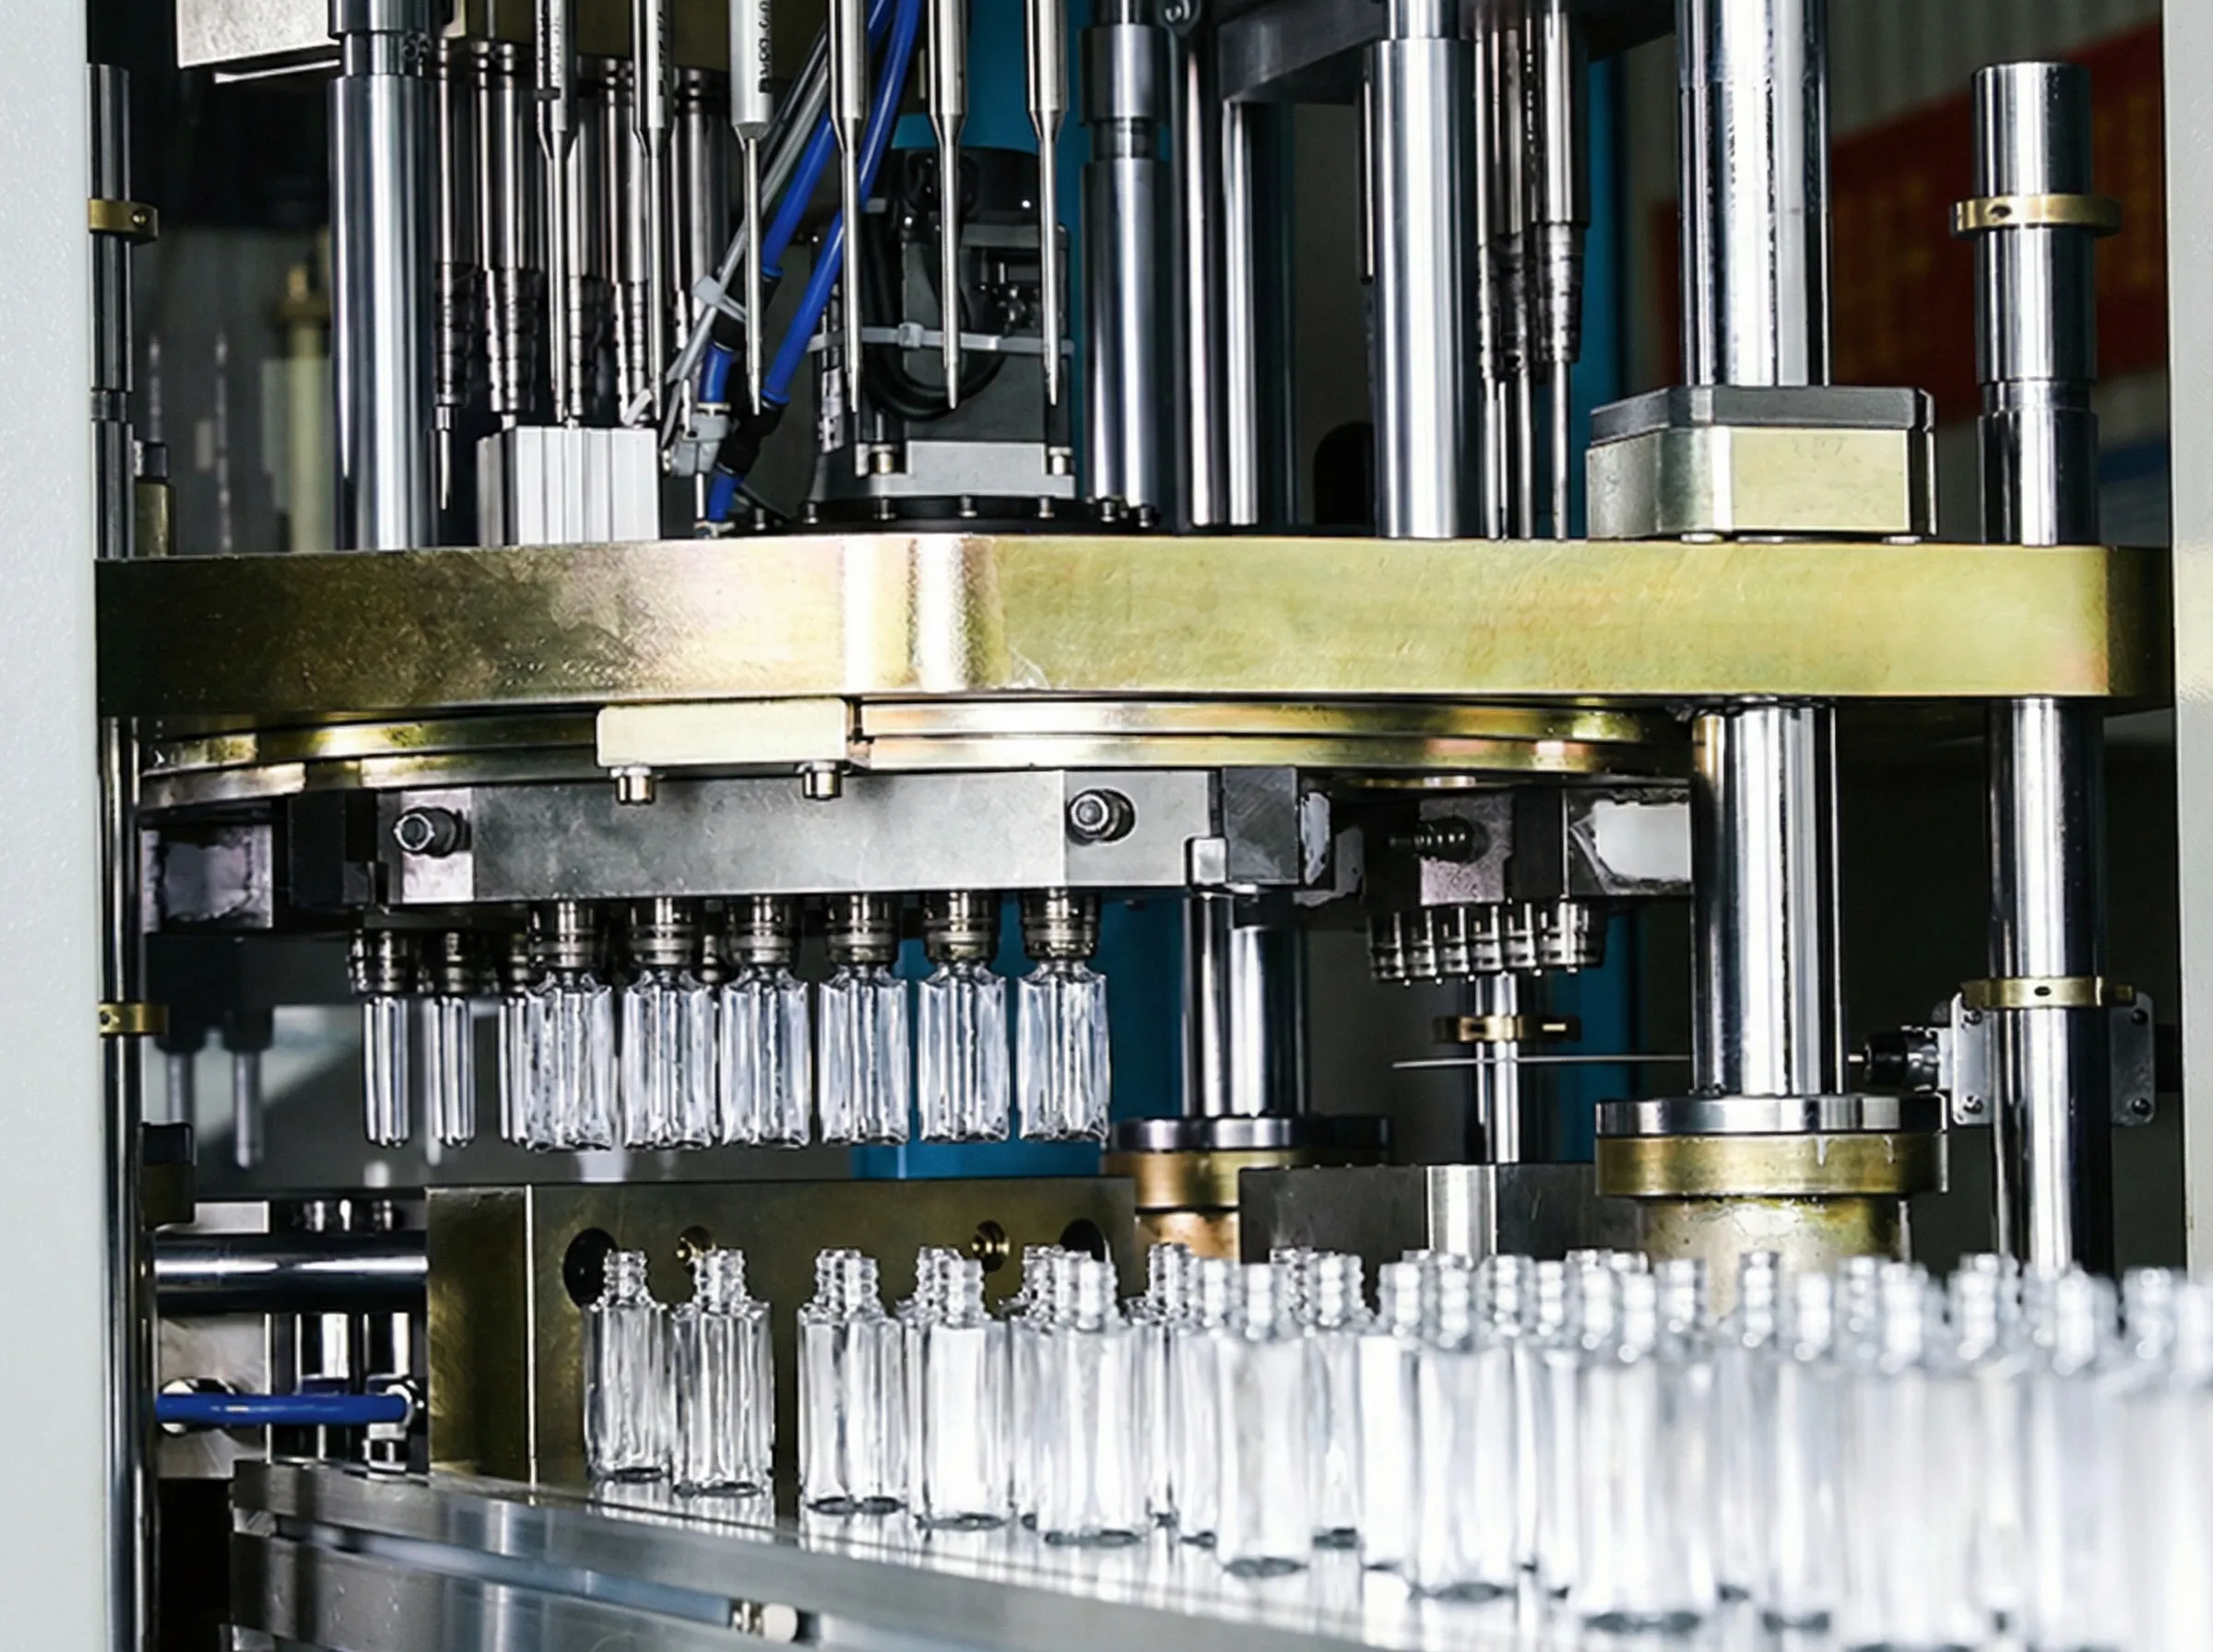
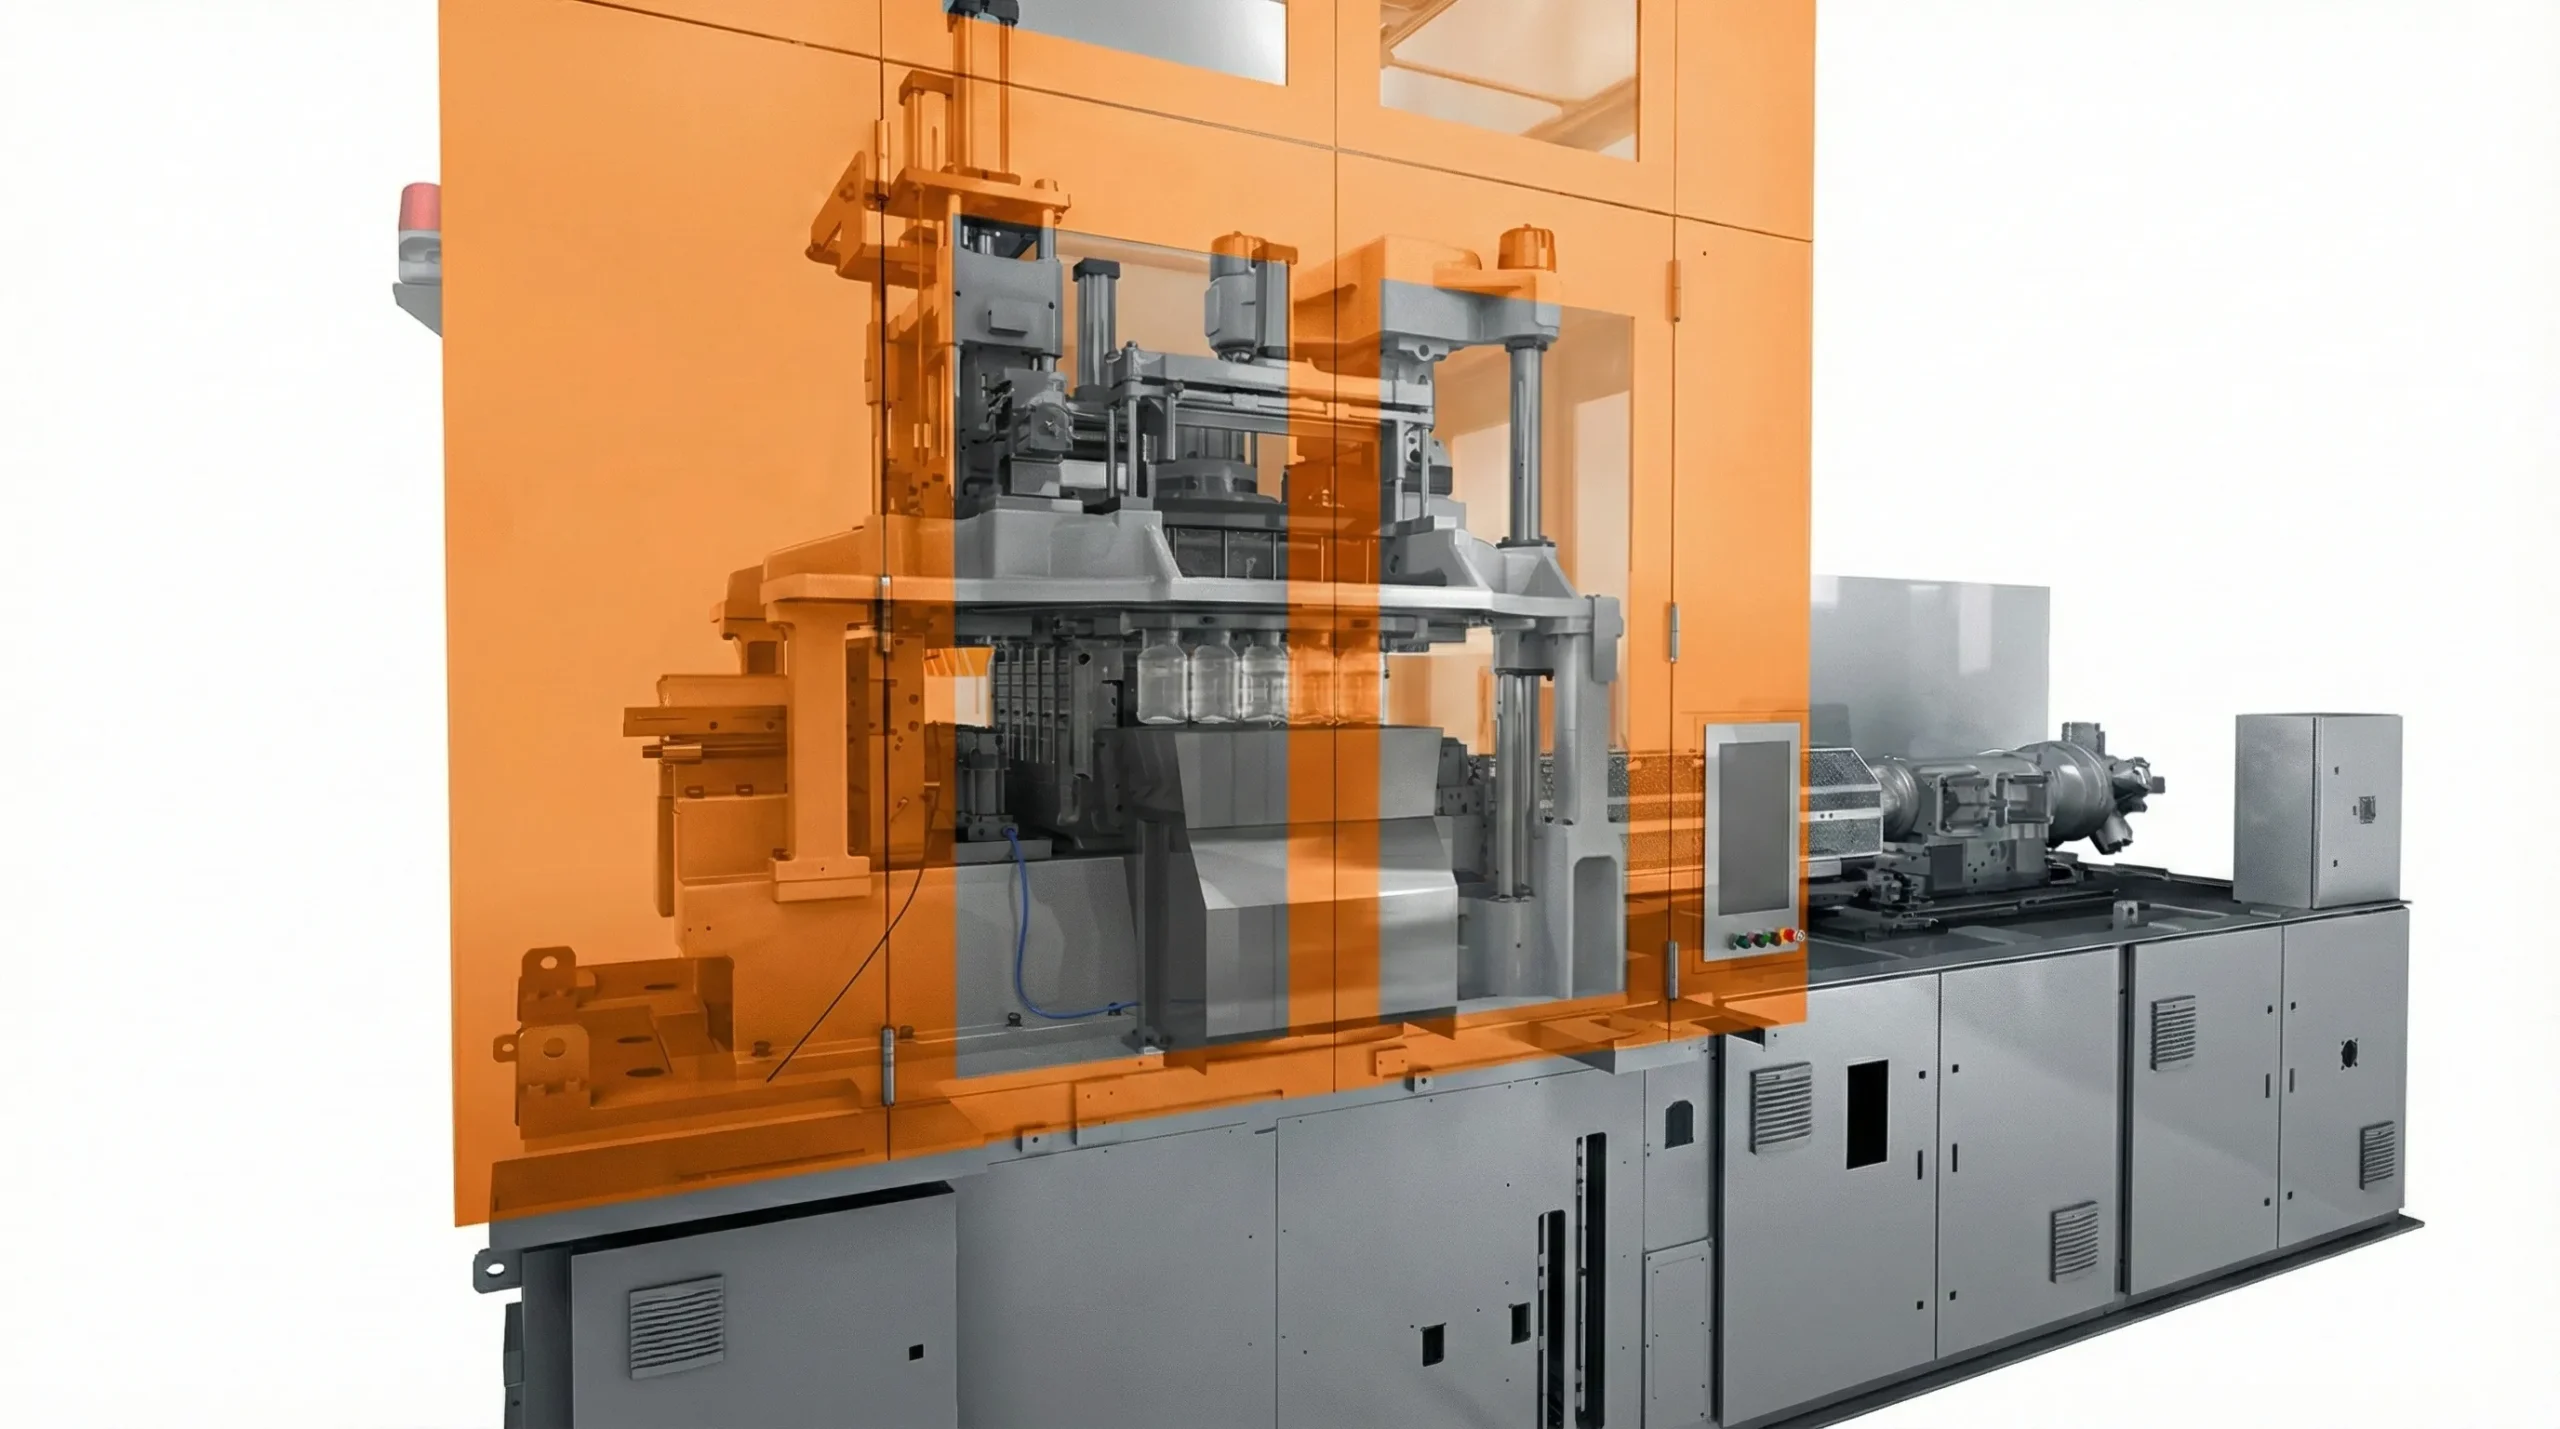
The Injection Stretch Blow Molding Process and Its Energy Implications
To fully understand why compressed air and electricity consumption figures are what they are, it is important to have a clear picture of how the injection stretch blow molding process actually unfolds within the machine. This is a sequential, synchronized multi-station process — and each station has distinct energy demands.
Station 1: Injection
Molten plastic (PET, PP, etc.) is injected into the preform cavity. This is the highest electrical demand phase — screw rotation, injection pressure, and heater bands all draw maximum power simultaneously. Good screw design and back pressure optimization are critical here.
Station 2: Temperature Conditioning
The preform is moved to a conditioning station where its temperature profile is optimized for blowing — hotter where stretch is needed, cooler where the neck finish must remain rigid. This station uses precise thermal management and consumes relatively modest but sustained electrical power.
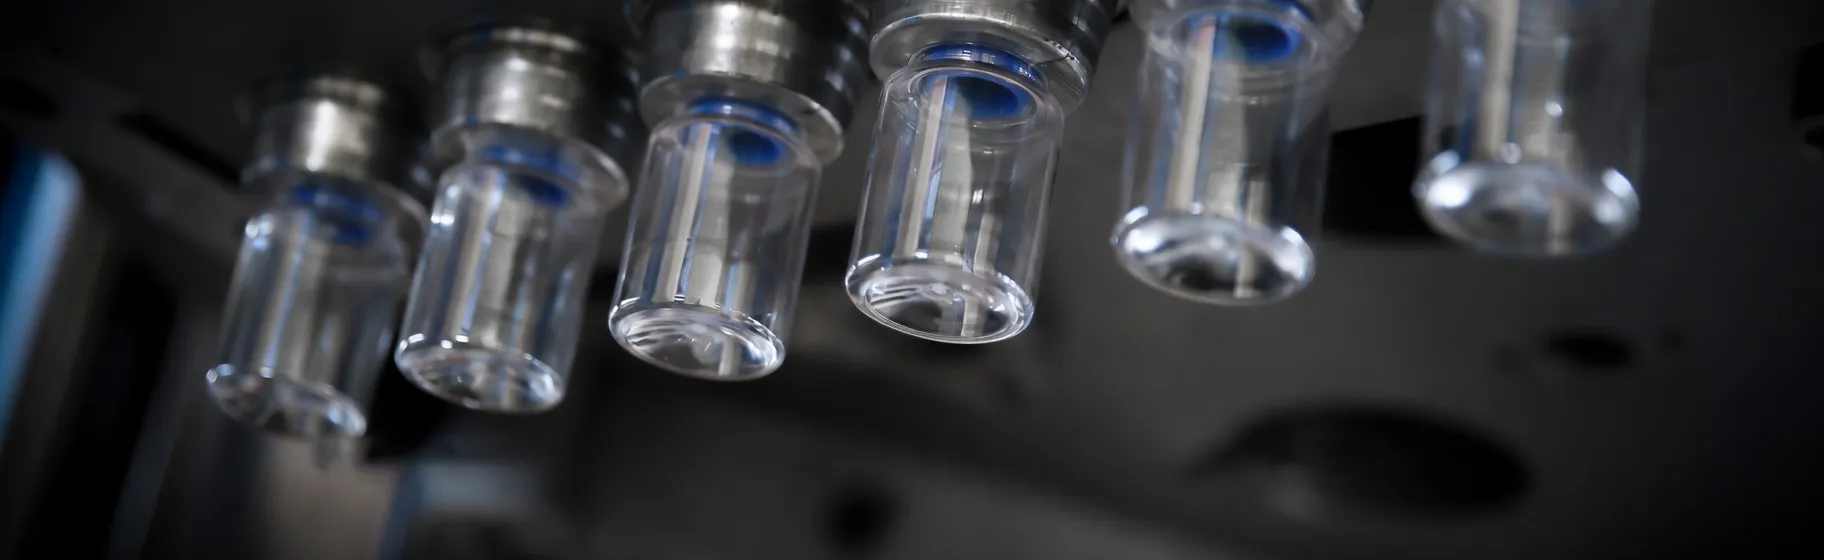
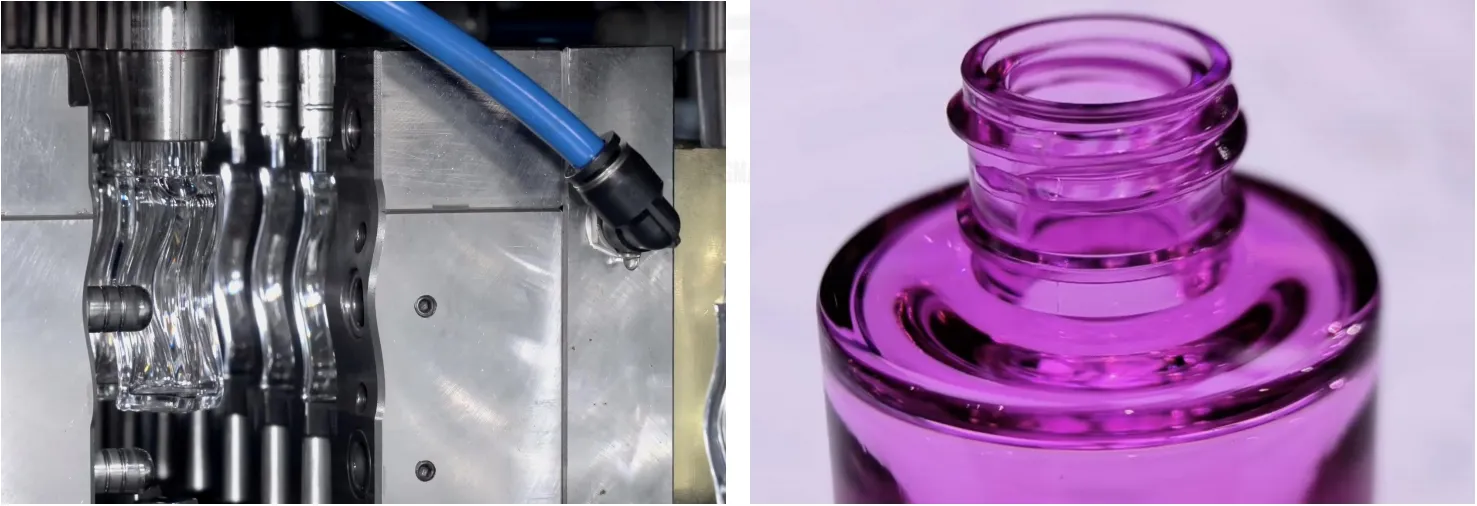
Station 3: Stretch & Blow
A stretch rod mechanically extends the preform while pre-blow air inflates it gently, followed by high-pressure final blow air to achieve the final shape. This is the peak compressed air demand phase — and the stage where air recovery systems, if fitted, capture exhaust air for reuse.
Station 4: Ejection & Cooling
The finished container is cooled against the mold, the mold opens, and the bottle is ejected. Cooling efficiency directly affects cycle time and throughput — and the mold temperature control system (chilled water circuits) is an ongoing electrical load that must be factored into total consumption.
The elegance of this single-cycle process is that thermal energy input from injection is partially retained through to the blowing station, eliminating the need for a separate reheating oven. This is why a well-optimized ISBM machine can produce containers with competitive energy footprints compared to two-step systems at equivalent throughput volumes.
How Leading ISBM Machine Manufacturers Are Improving Energy Efficiency
The competitive landscape among injection stretch blow molding machine manufacturers has intensified focus on energy efficiency as a key differentiator. Regulatory pressure in the EU, carbon disclosure requirements for publicly traded manufacturing companies, and the straightforward economics of rising industrial electricity costs are driving real innovation in machine design.
Among the notable technological trends reshaping ISBM energy performance are the following. First, all-electric and servo-hydraulic drive architectures are now mainstream in new machine designs from reputable manufacturers. These eliminate the energy waste inherent in conventional hydraulic systems running at constant pressure regardless of demand. Second, intelligent air management systems — including pressure sequencing valves, blow time optimization algorithms, and exhaust air recovery — are becoming standard features rather than premium add-ons.
Third, adaptive heating control on barrel zones — using PID algorithms and insulated barrel jackets — reduces thermal energy losses and shortens the machine warm-up period, which historically represents disproportionate energy consumption. Fourth, mold cooling optimization through conformal cooling channel designs and precision chiller temperature control can reduce cooling dwell time by 10–25%, improving throughput without additional energy input.
For companies operating older equipment from legacy suppliers — particularly those considering a replacement of aoki injection stretch blow molding machines or equivalent legacy technology — the energy savings available from upgrading to current-generation ISBM designs can be substantial. Independent energy audits of facilities making this transition have documented electricity savings of 20–35% and compressed air reductions of 15–25% per thousand bottles produced, depending on the age and condition of the replaced machine.
As an established isbm-muottien ruiskutuskoneiden toimittaja, Ever-Power invests continuously in drive system optimization, intelligent control architecture, and energy management features across its full machine range. We encourage prospective buyers to request energy consumption test reports under defined production conditions when evaluating any machine — and we provide this data transparently for every model we produce.
Practical Strategies for Reducing ISBM Operating Costs
Beyond machine specification, operational practices have a significant and often underestimated impact on energy consumption. The following measures represent best practice for facilities operating ISBM equipment at any scale.
Conduct Regular Compressed Air Audits
Use ultrasonic leak detectors to survey compressed air distribution systems at least annually. Leaks in fittings, hoses, and valves can account for up to 30% of total compressed air cost without any visible signs of failure.
Monitor Energy Per Unit Continuously
Install power meters and air flow meters tied to the production counter. Track kWh and Nm³ per 1,000 bottles as a daily KPI. Anomalies in this metric often signal process drift, material issues, or equipment deterioration before they become visible in quality data.
Optimize Barrel Temperature Profiles
Many operators run barrel temperatures higher than necessary “for safety.” Every 10°C reduction in processing temperature (within acceptable material limits) saves meaningful heater band energy and reduces cooling demands. Work with your material supplier to identify the optimal processing window.
Minimize Non-Productive Time
Every minute a machine runs in idle or standby while maintaining barrel temperature without producing bottles is wasted energy. Implement auto-standby protocols that reduce barrel set-points during planned breaks, and maintain rigorous mold change scheduling to minimize downtime between runs.
Maintain Mold and Machine Condition
Blocked mold cooling channels, worn check valves, and degraded barrel screws all increase energy consumption. A preventive maintenance program that tracks heat exchanger efficiency, screw wear, and valve performance will preserve energy efficiency across the machine’s service life.
Right-Size Your Compressor Infrastructure
Oversized compressors running at partial load waste significant energy. Variable-speed drive (VSD) compressors that modulate output to match demand precisely are the gold standard for facilities with fluctuating ISBM production schedules. Compressor infrastructure should be engineered concurrently with machine selection.
ISBM vs. Two-Step SBM: A Utility Cost Comparison Perspective
A common question from procurement teams evaluating their options is whether the one-step ISBM or two-step reheat-stretch-blow (RSBM) process offers better energy economics. The answer depends entirely on production context — particularly output volume, container type, and facility constraints — but some general principles apply.
The two-step process separates preform manufacturing from bottle blowing — enabling very high throughput on the blowing machine (because preforms are reheated rapidly using IR lamps) but requiring energy for that reheating that the ISBM process inherently avoids. For low-to-medium volume production runs with frequent material or container changes, the ISBM process typically delivers lower total energy per unit and superior economic performance. For very high-volume, single-SKU production (above 10,000 bottles per hour), two-step SBM systems often achieve lower energy-per-unit figures through economies of scale on the blow side.
What the ISBM process consistently provides — regardless of volume — is superior container quality through biaxial orientation control, the ability to produce wide-mouth, non-PET containers (PP, HDPE, PC), and the elimination of preform inventory logistics. These factors, combined with the energy profile described throughout this article, make the ISBM approach the preferred choice for specialty packaging, pharmaceutical containers, cosmetic packaging, and high-barrier food applications.
Buyers comparing options should note that compressed air consumption in two-step SBM systems can actually be lower per bottle at very high output — because the optimized blowing machines used in those systems are highly specialized. ISBM machines carry a broader energy overhead per cycle due to the integrated injection and conditioning functions. However, when the total system — including preform injection molding machine energy, transport logistics, and reheating — is included in the calculation, the one-step process frequently demonstrates a competitive or superior total energy footprint at comparable quality levels.
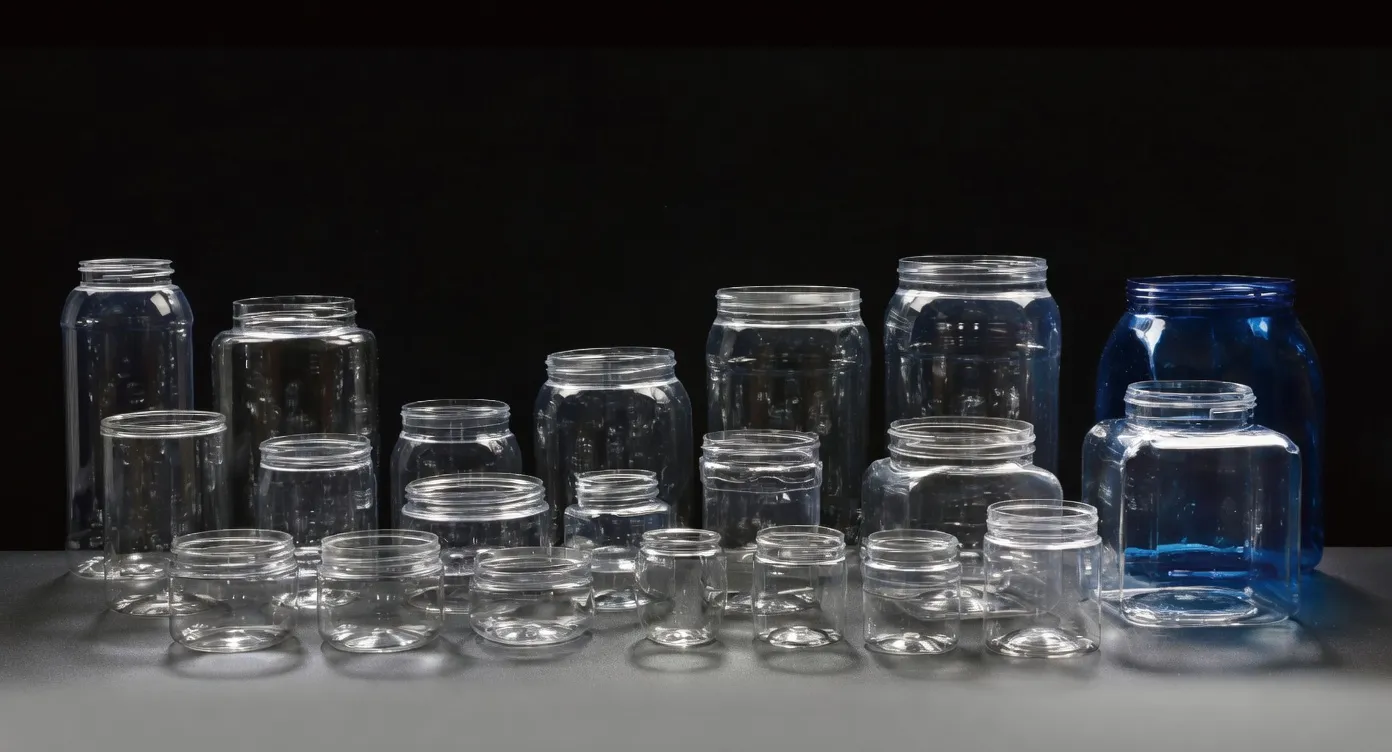
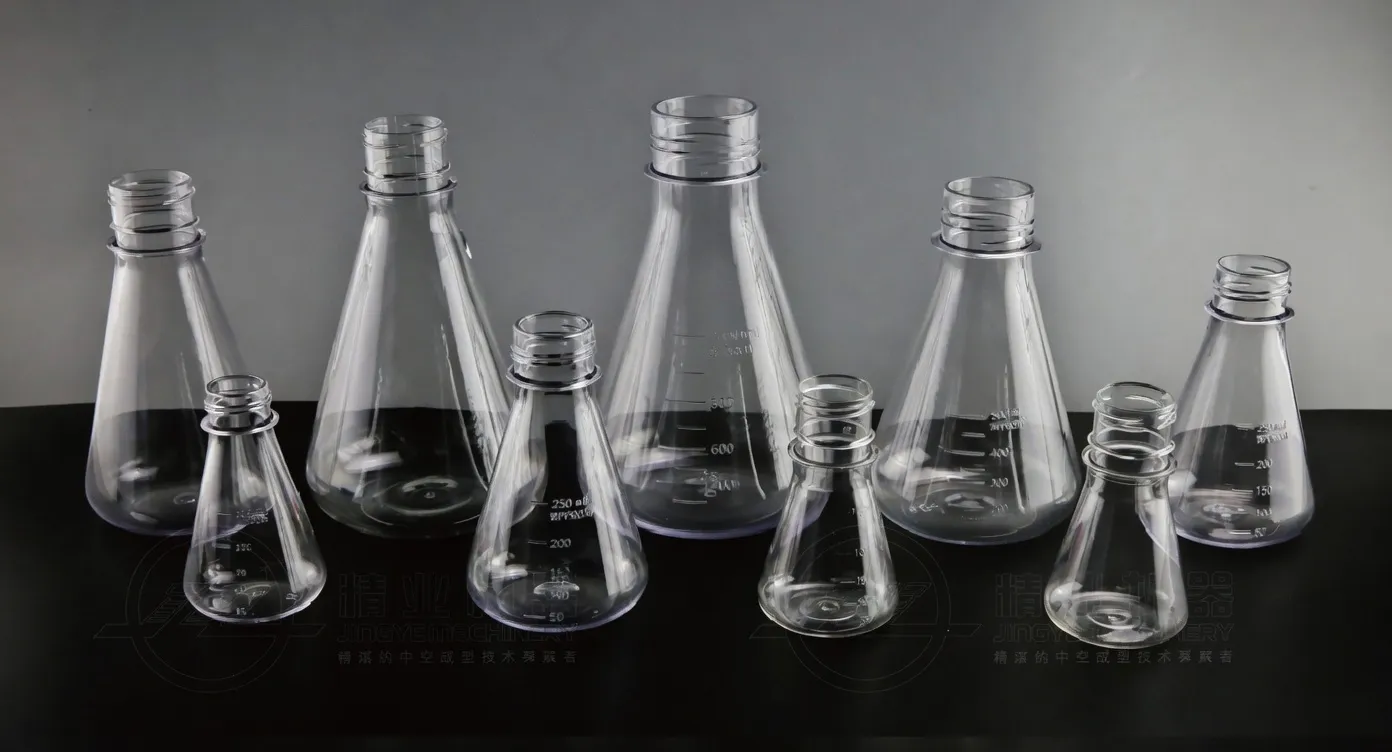
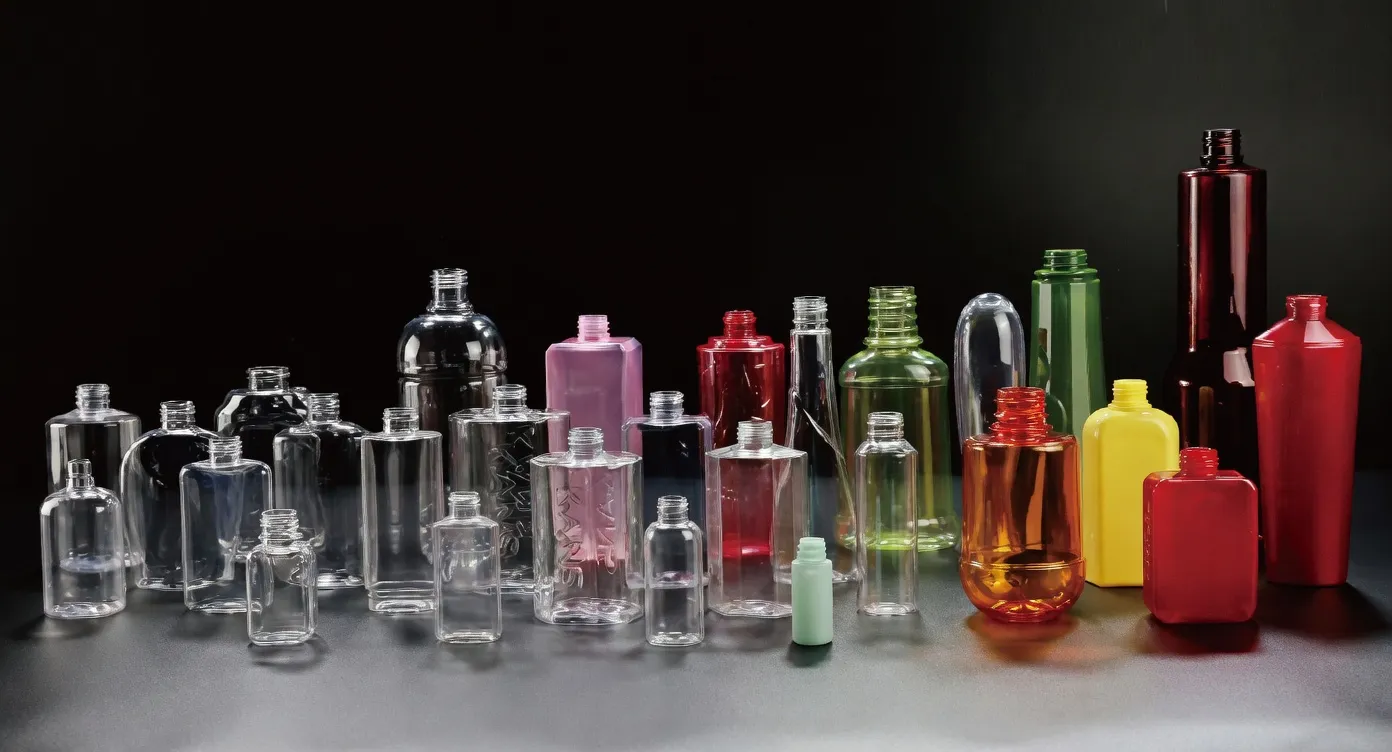
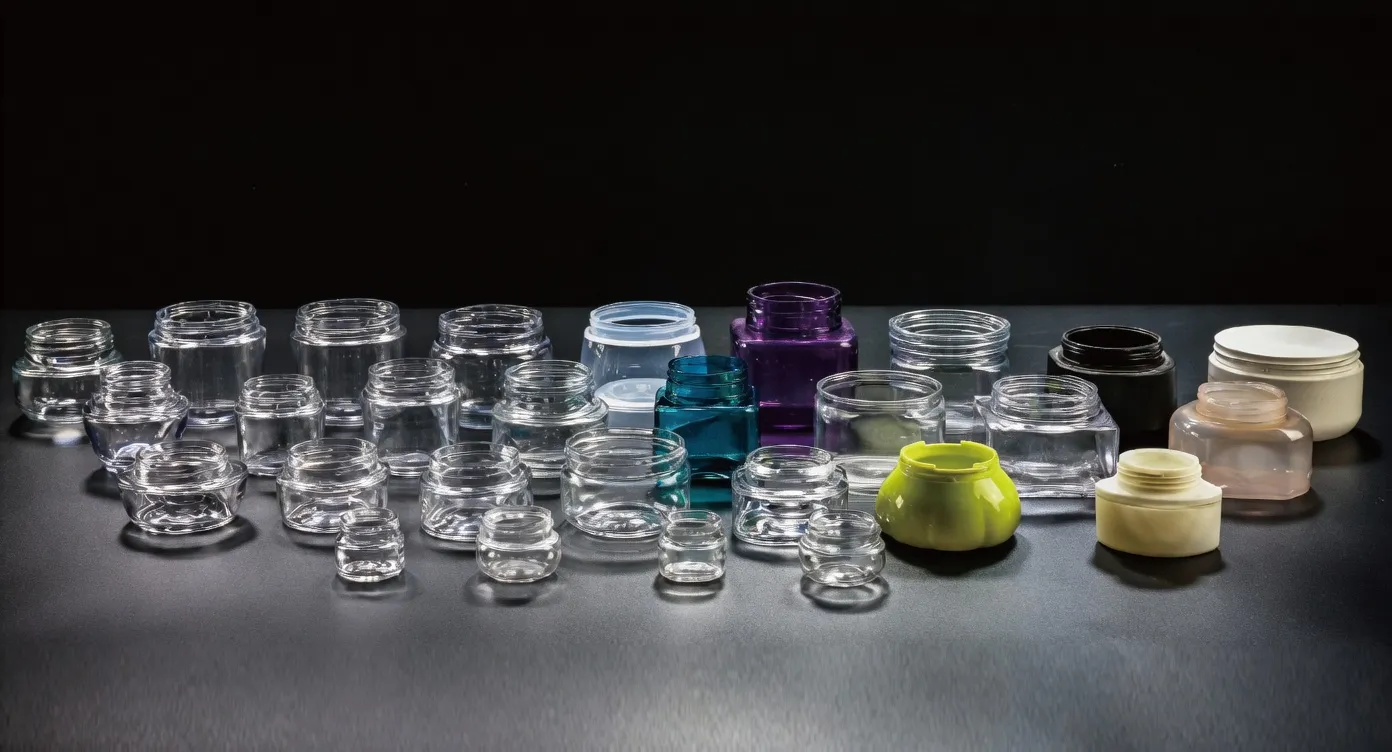
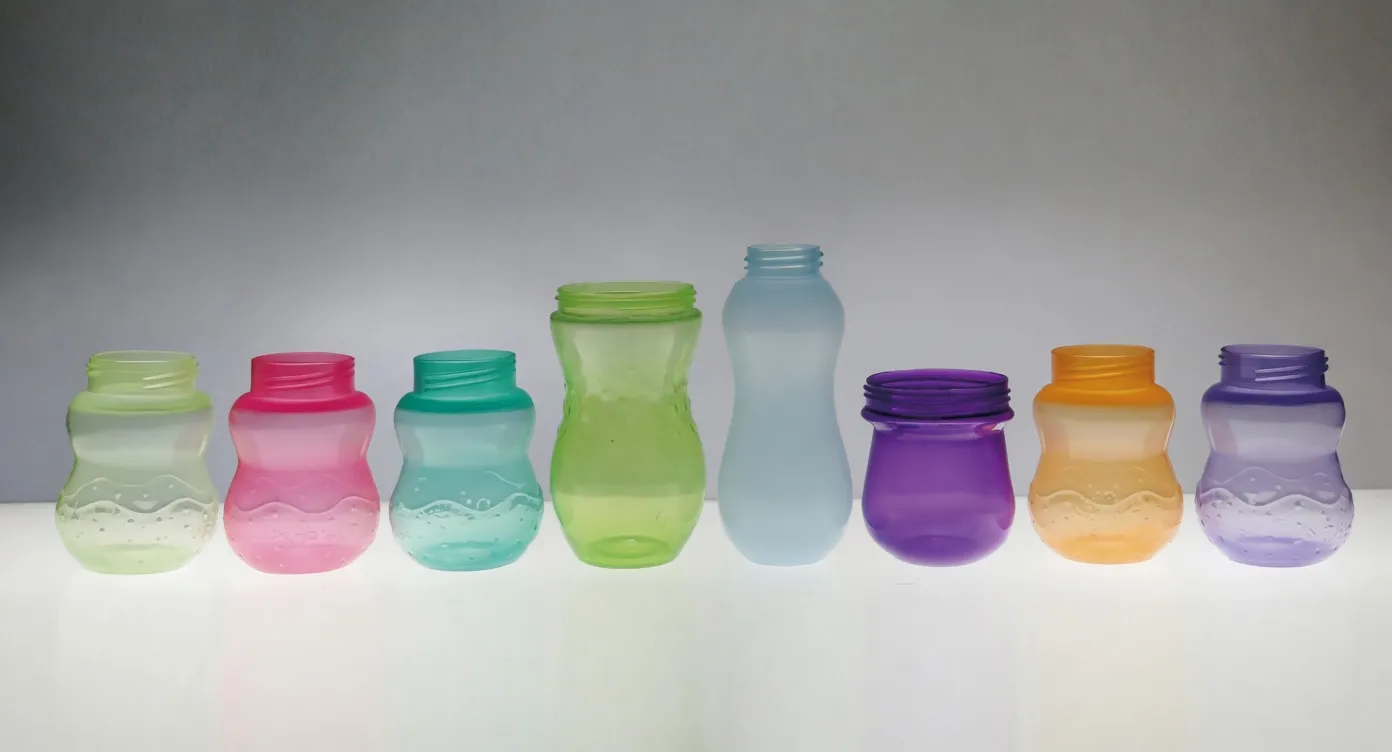
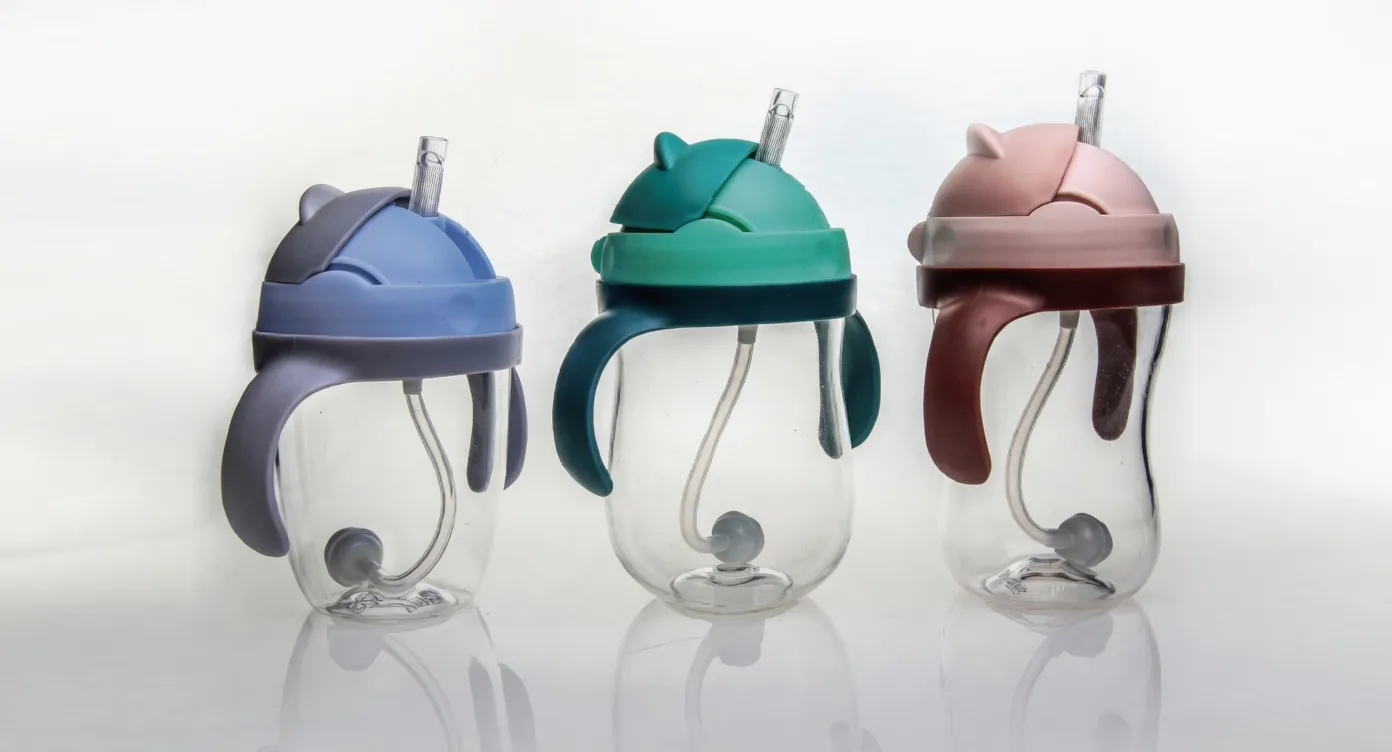
Bottle Samples Produced by Our ISBM Machines
Precision containers across industries — from beverages and pharmaceuticals to cosmetics and specialty food packaging.


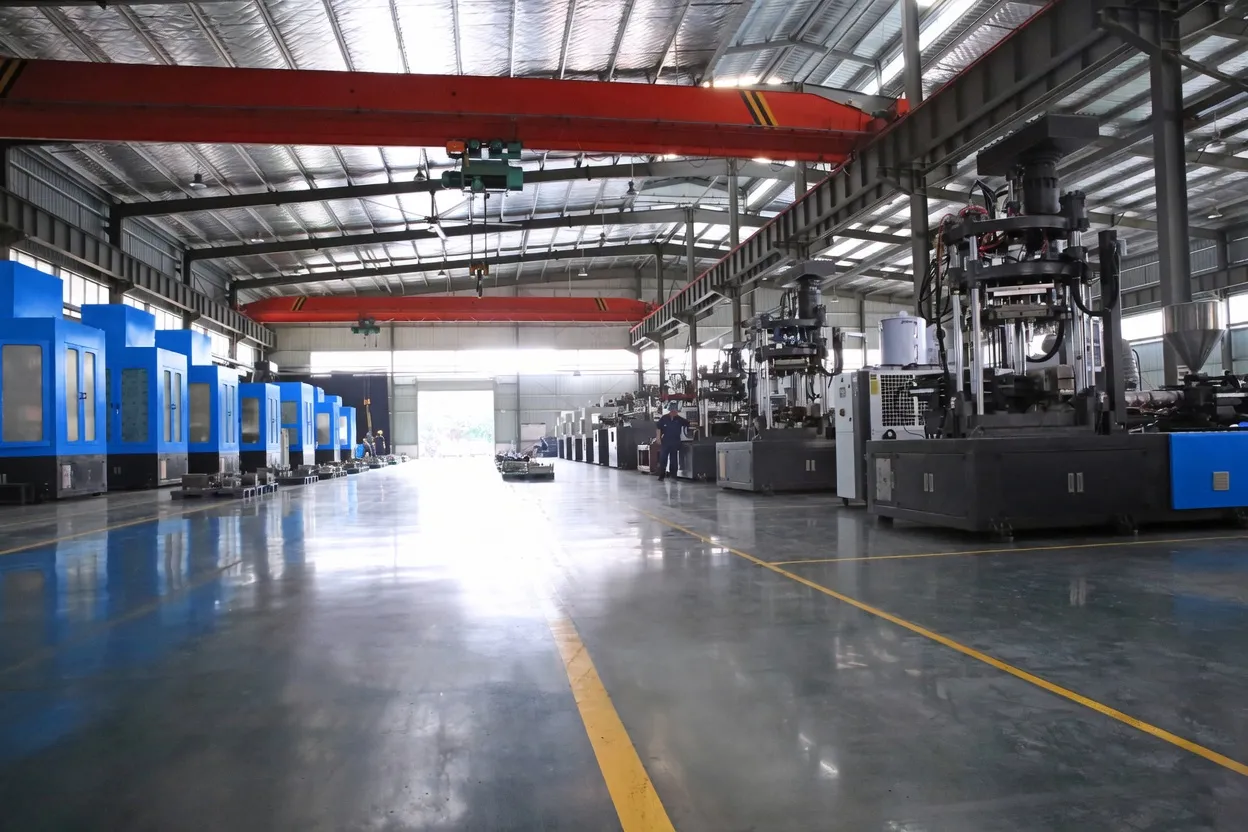
Our ISBM Machine Products
Ever-Power’s complete range of one-step injection stretch blow molding machines delivers precision engineering, energy-efficient drive systems, and proven reliability across a wide spectrum of container applications and production volumes.


Making the Right Decision: What to Ask Before Purchasing
Before finalizing any ISBM machine purchase — whether a new machine or a replacement for existing equipment — we recommend that procurement teams request the following technical documentation from all shortlisted suppliers. This applies whether you are sourcing from domestic suppliers or international equipment providers across Asia, Europe, or North America.
First, request a certified energy consumption test report measured at rated production output under standardized conditions — not the installed power figure alone, which tells only part of the story. Second, ask for compressed air consumption data specified by pressure circuit (low-pressure and high-pressure), flow rate (Nm³/h), and confirmed against a named container specification. Third, request references from existing customers operating machines in similar production environments, and if possible, arrange a factory trial or factory acceptance test (FAT) that includes utility monitoring.
Finally, consider the total cost of ownership over a 10-year operating horizon, not just the purchase price. A machine that costs $30,000 more upfront but consumes 25% less energy over 10 years of two-shift operation in a market with $0.12/kWh electricity rates will typically deliver a positive ROI on the energy premium within 2–4 years — and continue saving money for the remainder of its service life.
Ever-Power is committed to full transparency on all utility specifications. We maintain detailed energy consumption records for every machine model in our range, tested under real production conditions. Contact our technical sales team or visit our product pages to request project-specific consumption estimates based on your container specifications and target output rates.
Mitä asiakkaamme sanovat
Verified reviews from production managers and procurement directors across six continents.
“We replaced two aging competitors’ machines with EP-HGYS150 units last year. The compressed air consumption reduction alone — roughly 22% per 1,000 bottles — paid back a significant portion of the investment in under 18 months. Machine stability is excellent, with almost zero unplanned downtime in over 8 months of continuous operation.”
“As a pharmaceutical packaging manufacturer, precision and consistency are non-negotiable. The Ever-Power EP-HGYS200 has delivered absolutely consistent wall thickness and neck finish quality across millions of cycles. The after-sales technical support team responded within hours to our commissioning questions — exceptional service.”
“Delivery was completed ahead of schedule — 6 weeks from order confirmation to machine arrival at our facility in Stuttgart. Installation and training were thorough. The electricity consumption figures provided by Ever-Power’s technical team matched real-world production data within 5%, which is far better accuracy than we’ve experienced with previous suppliers.”
“We evaluated five suppliers before choosing Ever-Power for our cosmetic packaging line in São Paulo. The EP-HGYS280-V6 six-station machine was the only option that could meet our output targets at the cavity count we required. Energy consumption is very efficient for the volume we’re producing, and the bottle clarity on our PP containers is outstanding.”
“The servo-controlled EP-HGYS150-V4-EV was a revelation for our food-grade packaging facility in Cape Town. Compared to our previous hydraulic machine, the noise level is dramatically lower and the power bills have dropped noticeably. Machine stability over 12-hour continuous production shifts has been impeccable. Would recommend without hesitation.”
“Our EP-HGY650-V4 heavy-duty machine has been running our wide-mouth HDPE container line for over two years without a single major incident. The original mold tooling quality was exceptional, and the compressed air system design recommendations from the Ever-Power engineering team saved us significant infrastructure cost during installation planning.”


